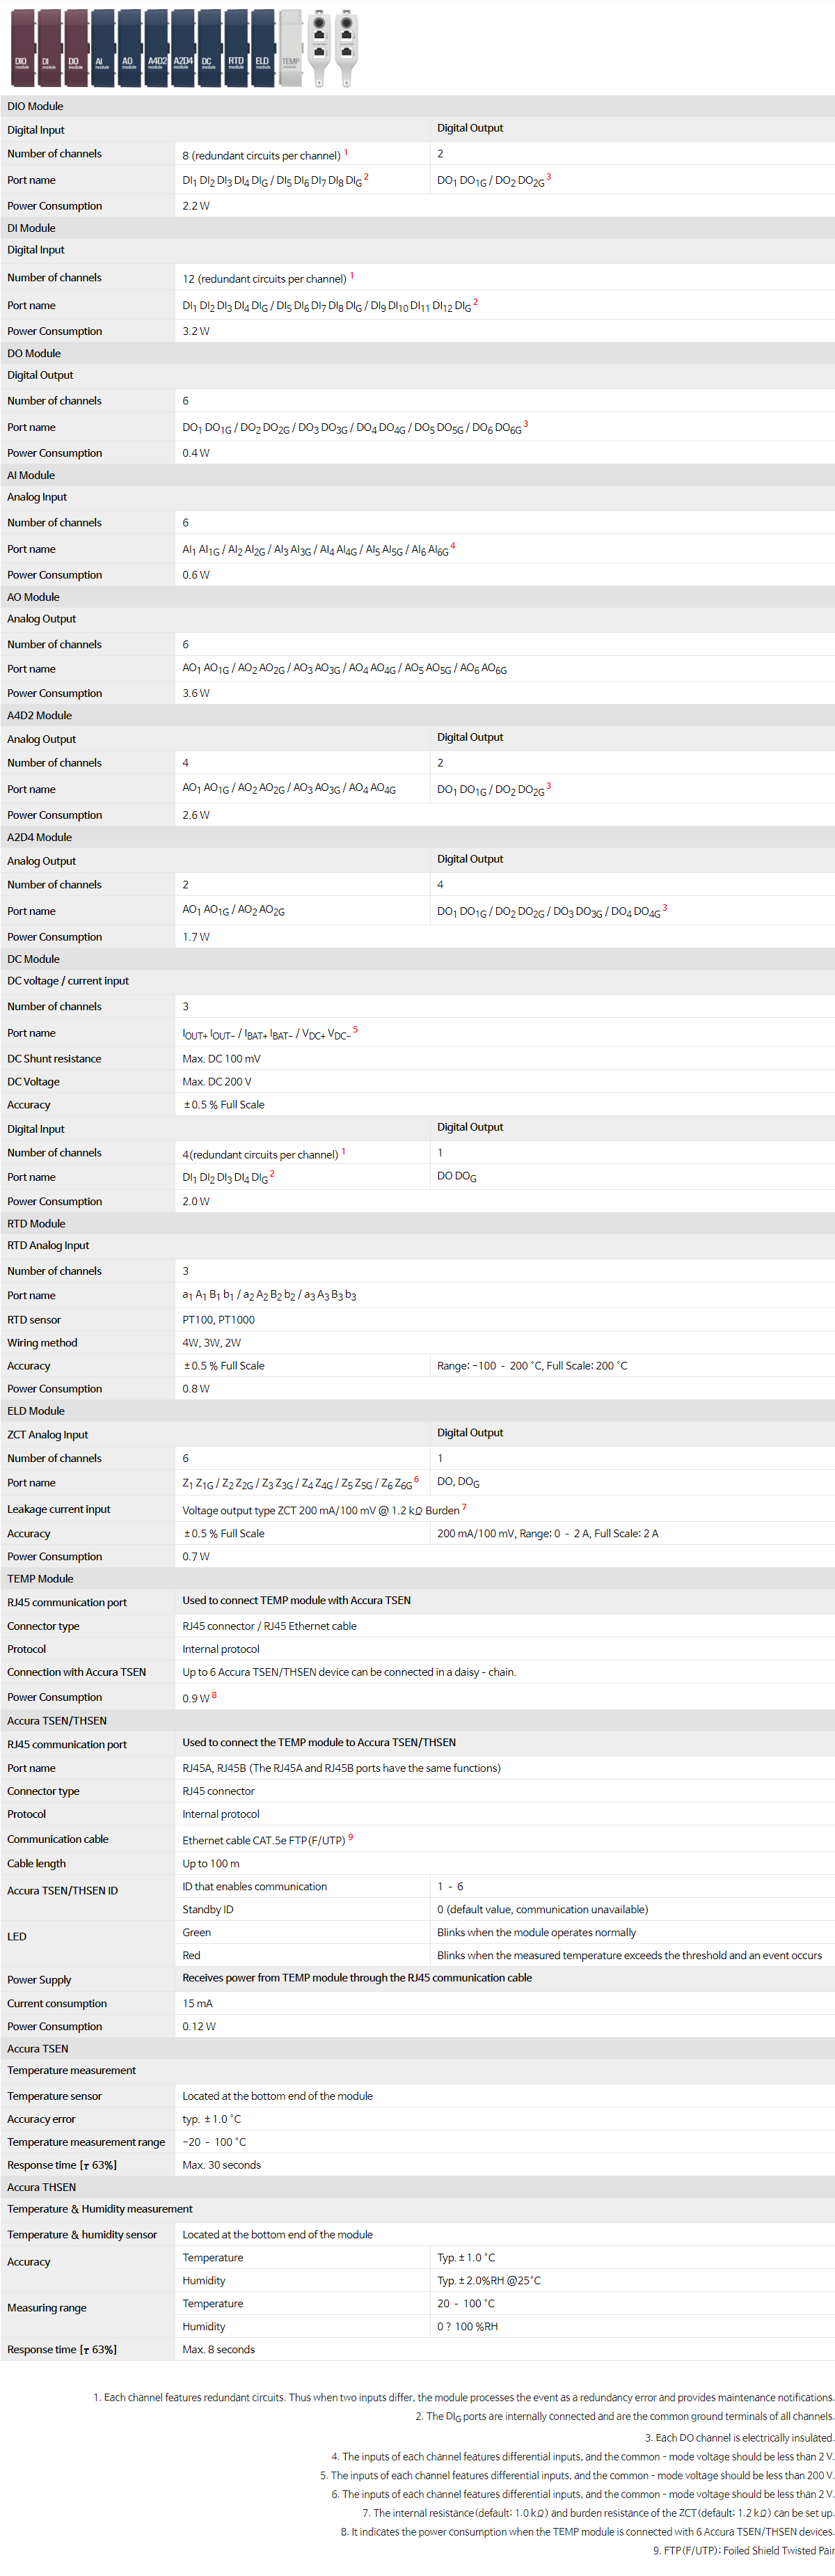
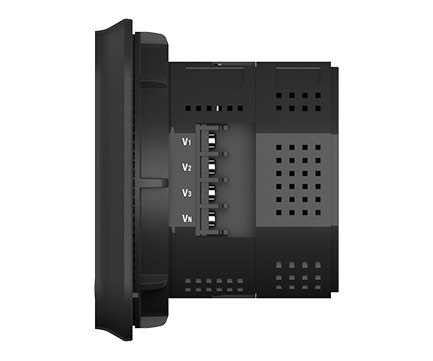
| Voltage Input |
| Port name |
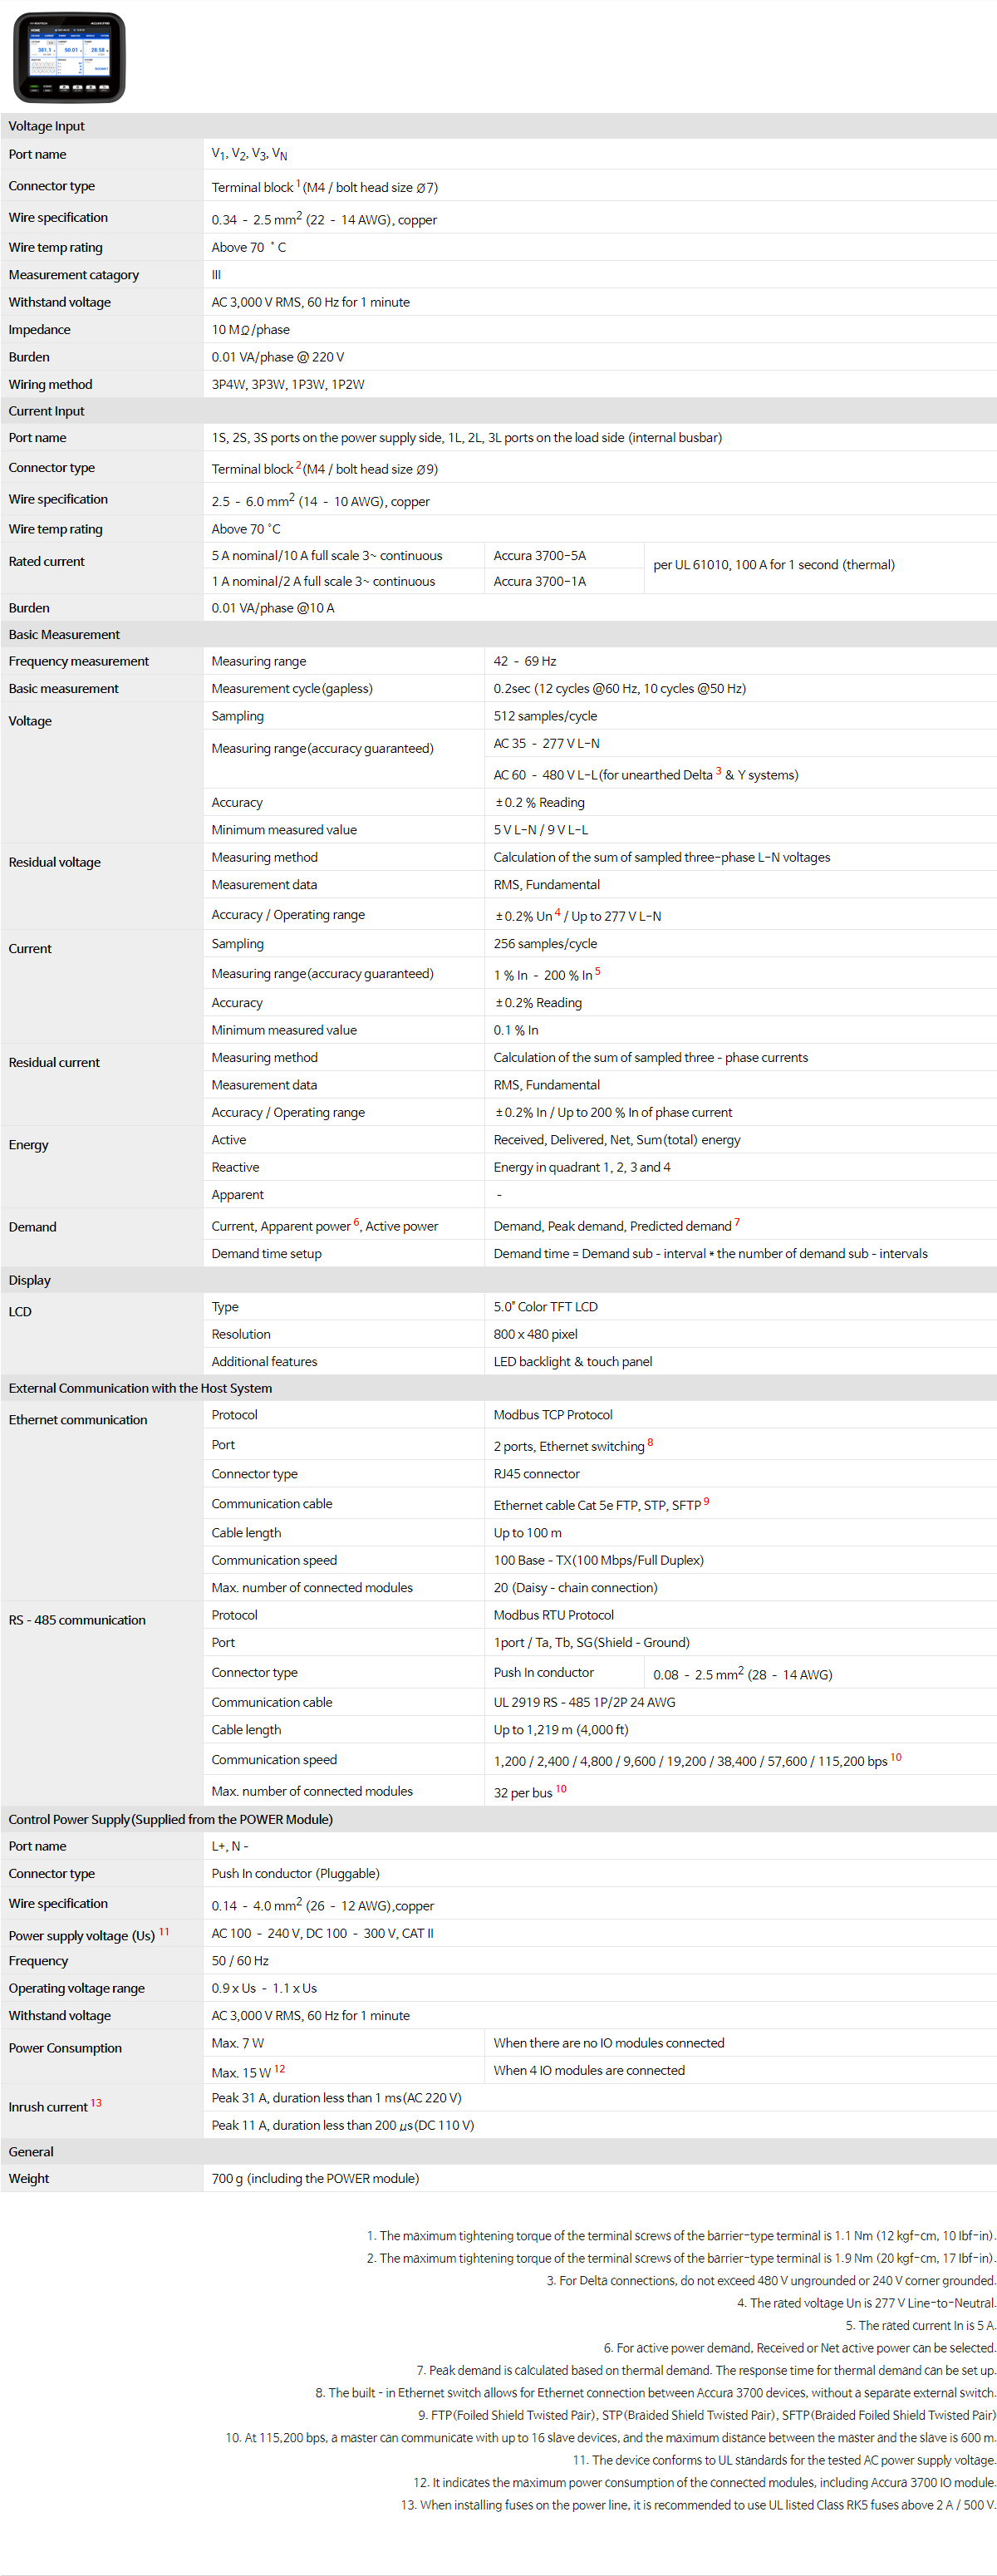
V1, V2, V3, VN |
| Connector type |
Terminal block (M4 / bolt head size Ø7) |
| Wire specification / Torque |
0.34 — 2.5 mm2 (22 — 14 AWG), copper / max. 1.1 Nm (12 kgf-cm, 10 lbf-in) |
| Wire temp rating |
70 ˚C or higher |
| Measurement catagory |
III |
| Withstand voltage |
AC 3,000 V RMS, 60 Hz for 1 minute |
| Impedance |
10 MΩ/phase |
| Burden |
0.01 VA/phase @ 220 V |
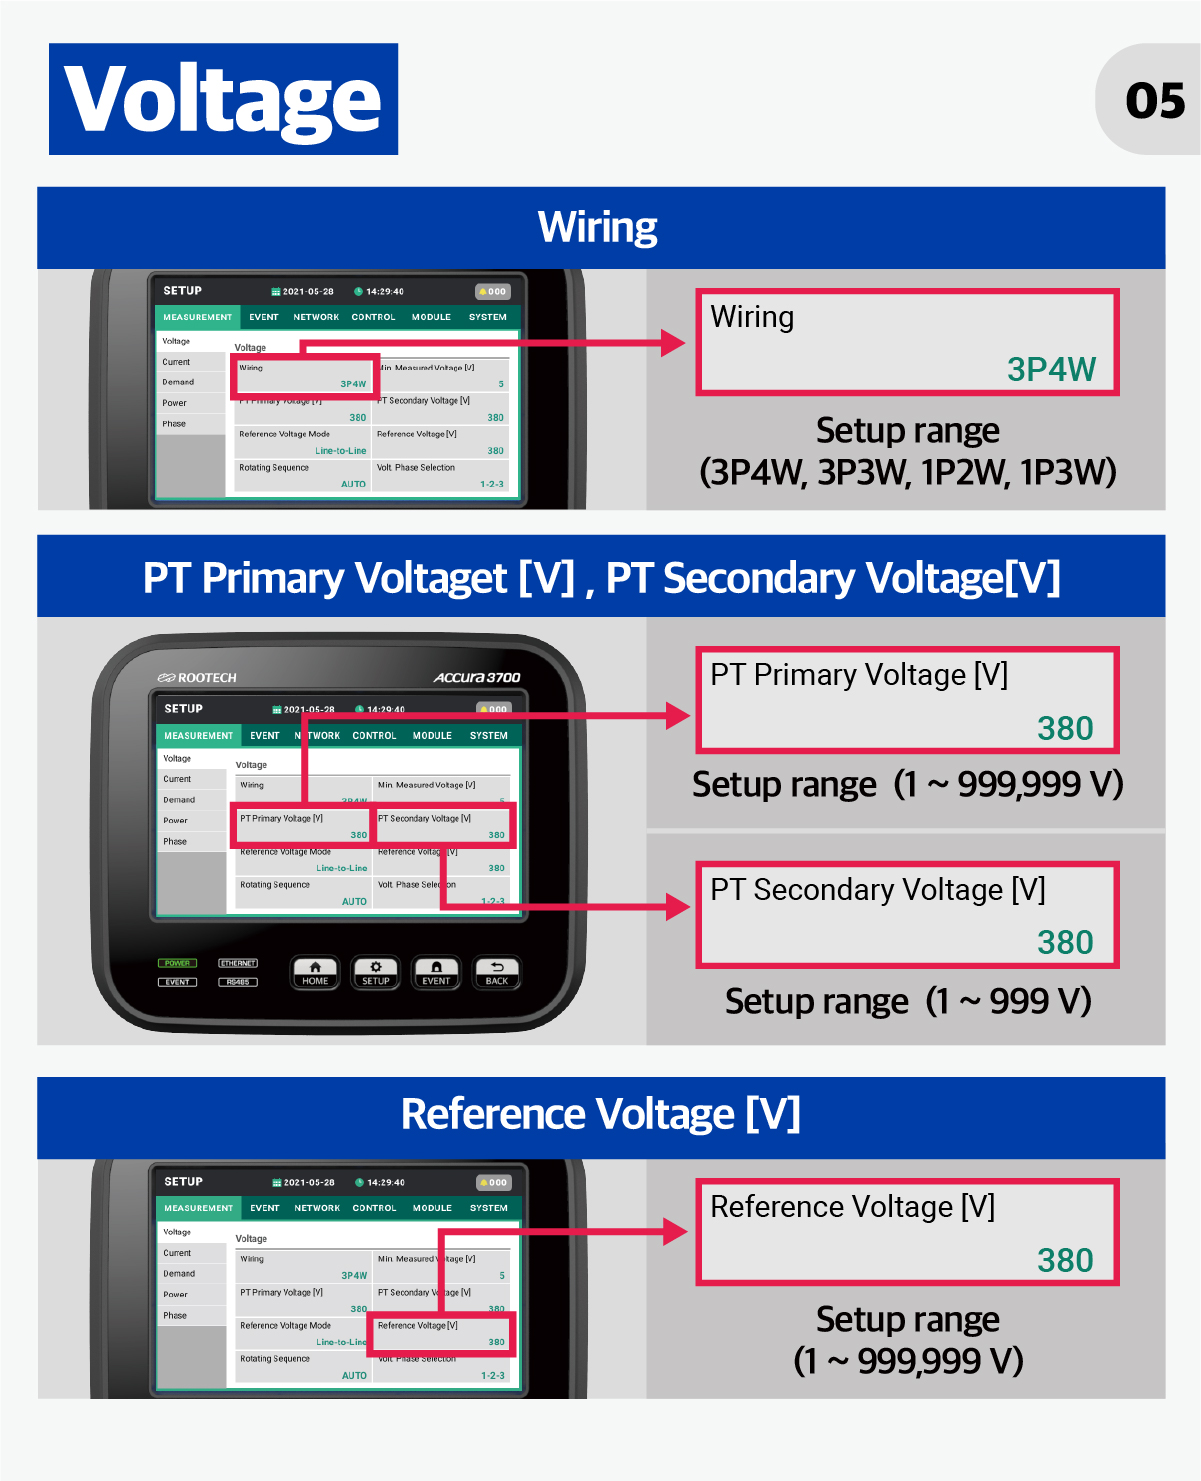
| Wiring method |
3P4W, 3P3W, 1P3W, 1P2W |
| Current Input |
| Port name |
1S, 2S, 3S ports on the power supply side, 1L, 2L, 3L ports on the load side (internal busbar) |
| Connector type |
Terminal block (M4 / bolt head size Ø9) |
| Wire specification / Torque |
2.5 — 6.0 mm2 (14 — 10 AWG), copper / max. 1.9 Nm (20 kgf-cm, 17 lbf-in) |
| Wire temp rating |
70 ˚C or higher |
|
Rated current
|
5 A nominal/10 A full scale 3~ continuous |
Accura 3700-5A |
per UL 61010, 100 A for 1 second (thermal)
|
| 1 A nominal/2 A full scale 3~ continuous |
Accura 3700-1A |
| Burden |
0.01 VA/phase @10 A |
| Basic Measurement |
| Frequency measurement |
Measuring range |
42 — 69 Hz |
| Basic measurement |
Measurement cycle(gapless) |
0.2 s (12 cycles @60 Hz, 10 cycles @50 Hz) |
|
Voltage
|
Sampling |
512 samples/cycle |
|
Measuring range(Accuracy guaranteed)
|
AC 35 — 277 V L-N (Line-to-neutral) |
| AC 60 — 480 V L-L (for unearthed Delta1 & Y systems) |
| Accuracy |
±0.2 % Reading |
| Minimum measured value |
5 V L-N / 9 V L-L |
|
Measurement data |
Line-to-neutral, Line-to-line voltage |
| Fundamental, Harmonics (up to the 50th order)2 |
| Phasor diagram, THD |
| Symmetrical components (positive-, negative-, zero-sequence components) |
| Unbalance according to symmetrical components / the NEMA standard |
|
Residual voltage
|
Measuring method |
Calculated from the sum of the three-phase voltages (supported only for 3P4W, 1P3W) |
| Measurement data |
RMS, Fundamental |
| Accuracy / Operating range |
±0.2% Un3 / Up to 277 V Line-to-neutral |
|
Current
|
Sampling |
256 samples/cycle |
|
Measuring range(Accuracy guaranteed)
|
1 % In — 200 % In4 |
Accura 3700-5A |
| 5 % In — 200 % In4 |
Accura 3700-1A |
| Accuracy |
±0.2 % Reading |
| Minimum measured value |
5 mA |
|
Measurement data |
Phase current |
| Fundamental, Harmonics (up to the 50th order) |
| Phasor diagram, THD, TDD |
| Symmetrical components (positive-, negative-, zero-sequence components) |
| Unbalance according to symmetrical components / the NEMA standard |
|
Residual current
|
Measuring method |
Calculated from the sum of the three-phase currents |
| Measurement data |
RMS, Fundamental |
| Accuracy / Operating range |
±0.2 % ln / Up to 200 % ln of phase current |
|
Energy
|
Active |
Received, Delivered, Net, Sum(total) energy |
| Reactive |
Energy in quadrant 1, 2, 3 and 4 |
| Apparent |
– |
|
Demand
|
Current, Apparent power5, Active power |
Demand, Peak demand, Predicted demand6 |
| Demand time setup |
Demand time = Demand sub–interval * the number of demand sub–intervals |
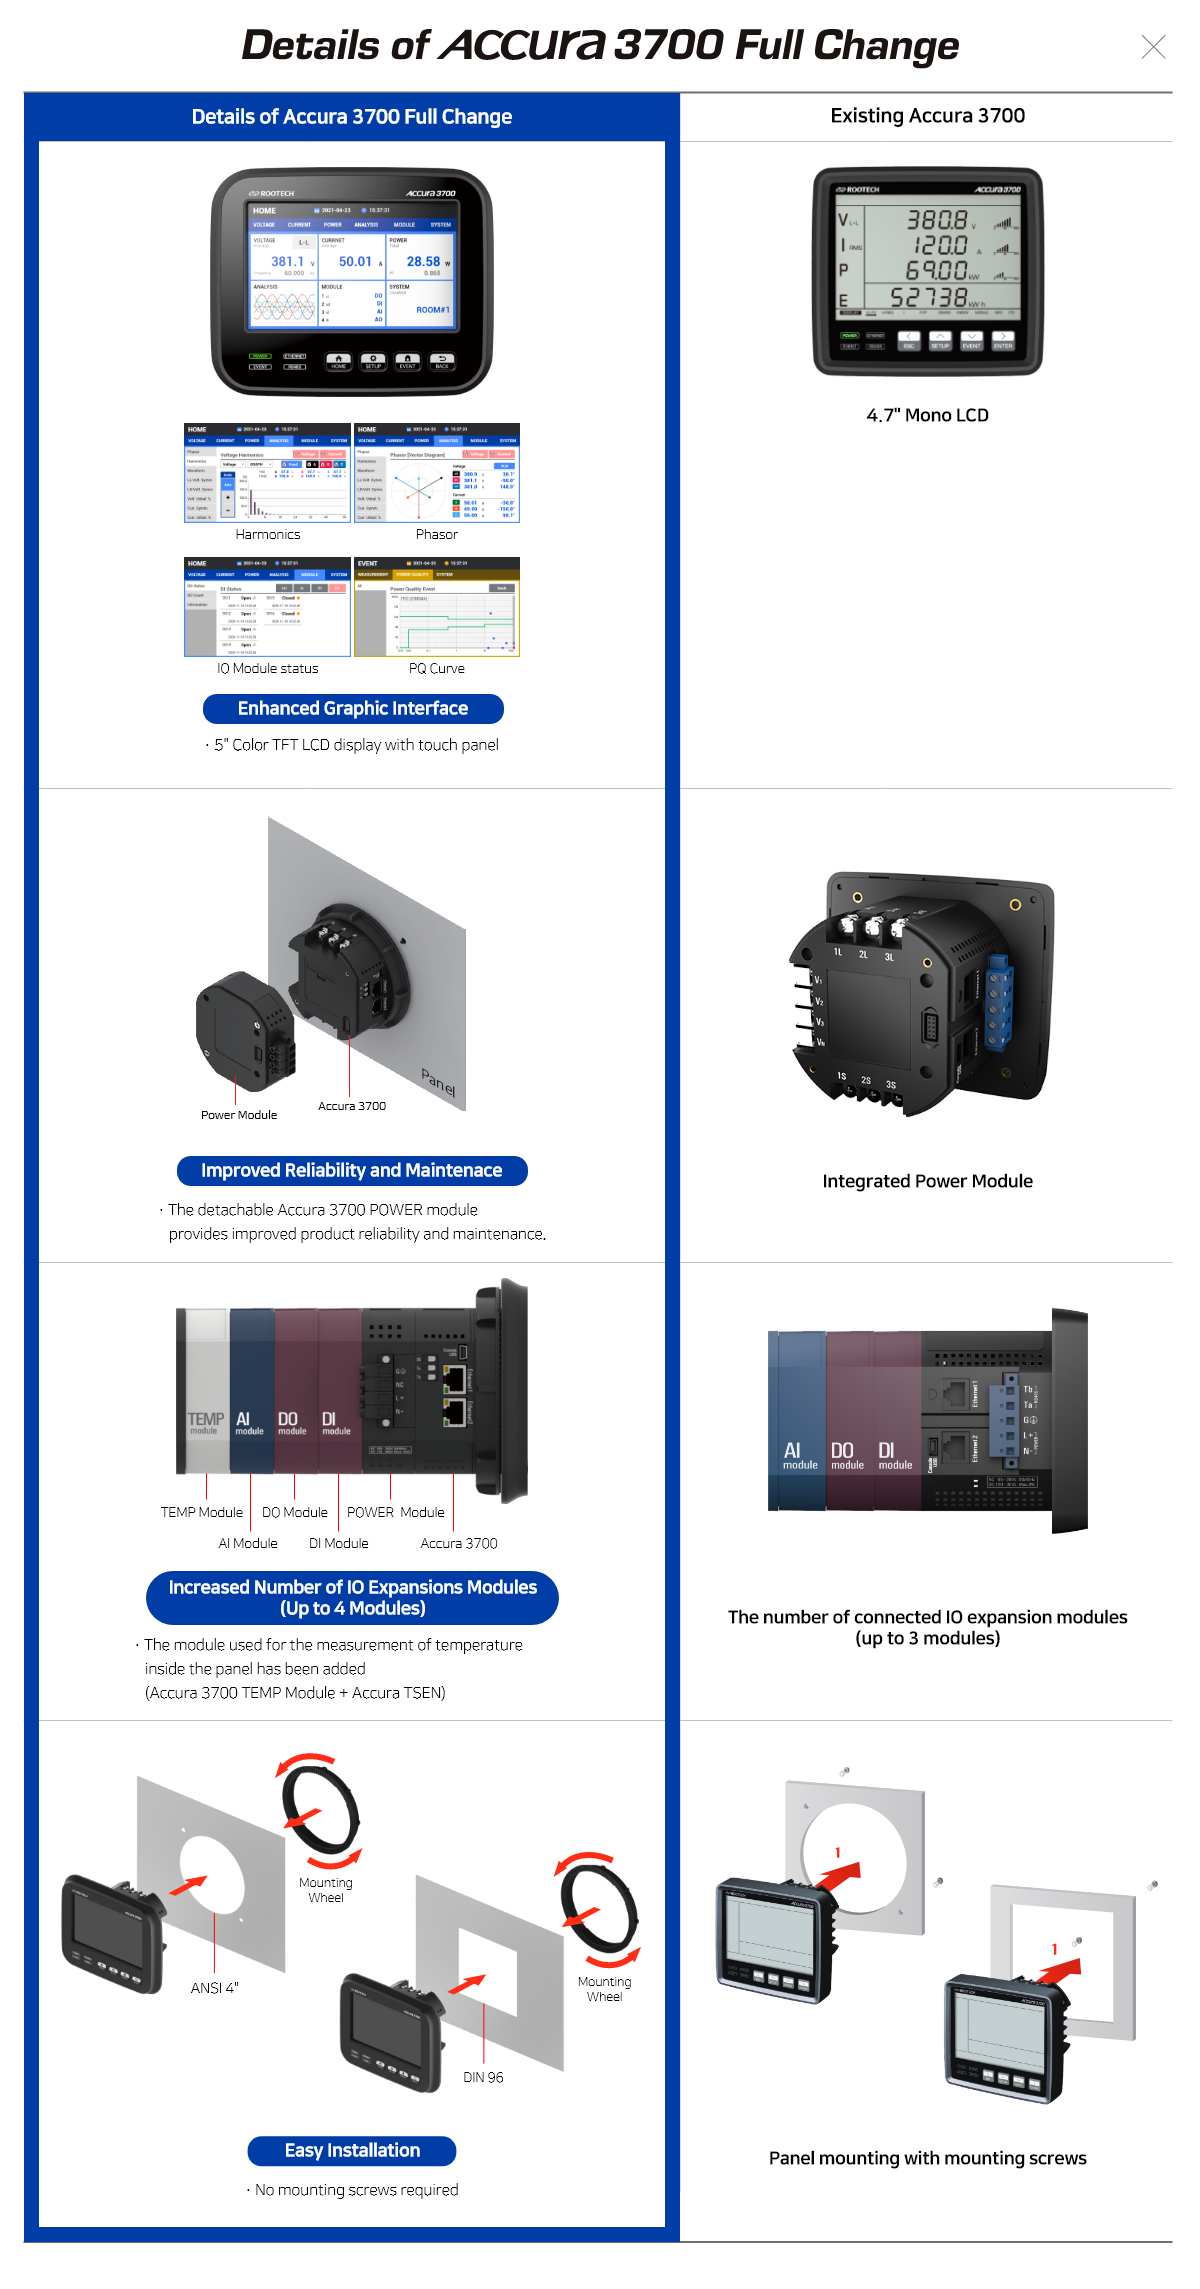
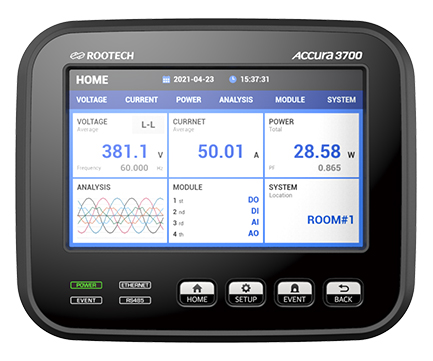
| Display |
|
LCD
|
Type |
5.0" Color TFT LCD |
| Resolution |
800 x 480 pixel |
| Additional features |
LED backlight & touch panel |
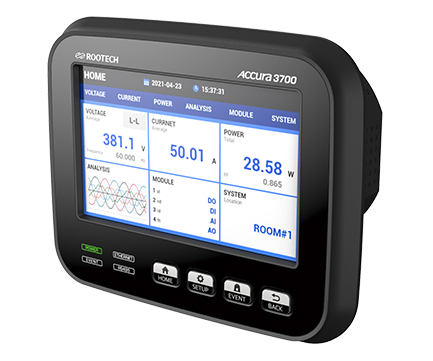
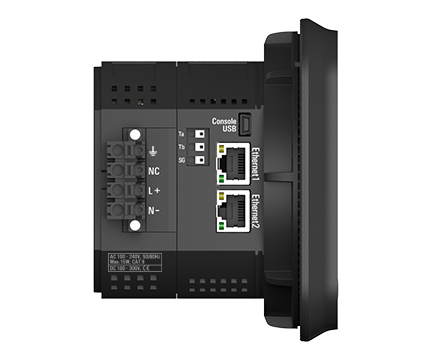
| External Communication with the Host System |
|
Ethernet communication
|
Protocol |
Modbus TCP Protocol |
| Port |
2 ports, Ethernet switching7 |
| Connector type |
RJ45 connector |
| Communication cable
|
Ethernet cable Cat 5e FTP, STP, SFTP8 |
| Cable length |
Up to 100 m |
| Bit rate |
100 Base–TX(100 Mbps/Full Duplex) |
| Wiring methods |
Star, daisy-chain, ring topology (RSTP9 support) |
| Max. number of connected modules |
20 |
|
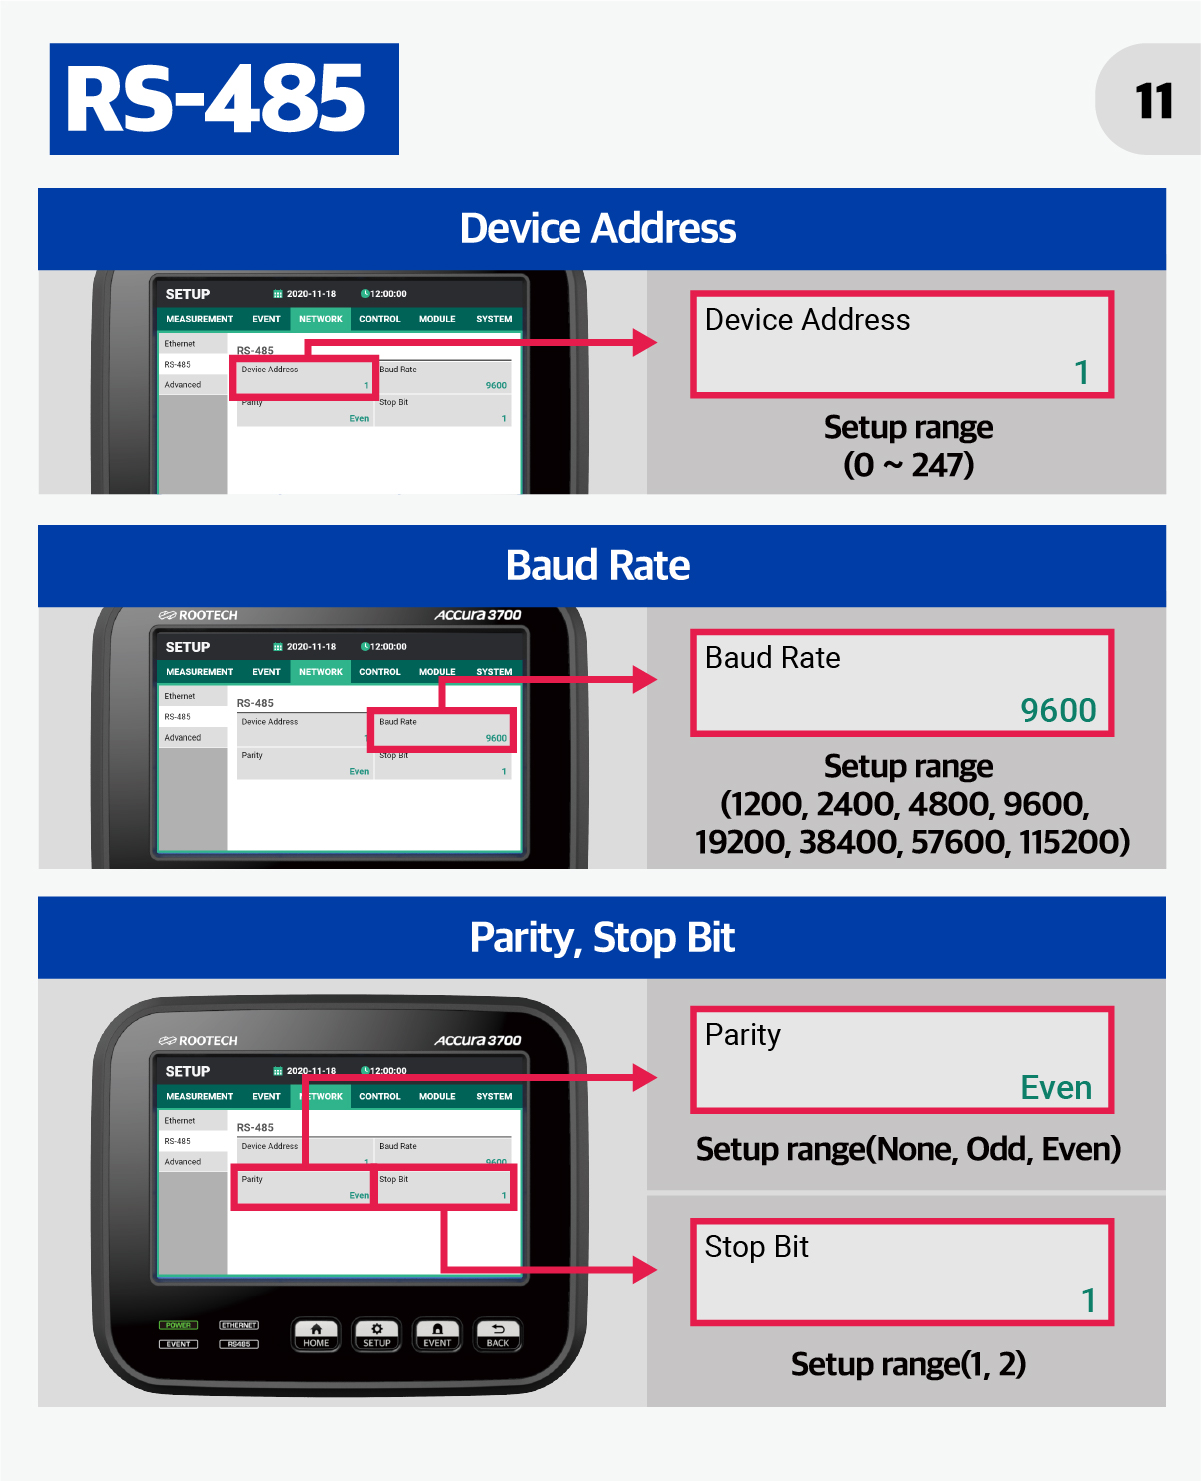
RS–485 communication
|
Protocol |
Modbus RTU Protocol |
| Port |
1port / Ta, Tb, SG(Shield–Ground) |
| Connector type |
Push In conductor |
0.08 — 2.5 mm2 (28 — 14 AWG) |
| Communication cable |
UL 2919 RS–485 1P/2P 24 AWG |
| Cable length |
Up to 1,219 m (4,000 ft) |
| Communication speed |
1,200 / 2,400 / 4,800 / 9,600 / 19,200 / 38,400 / 57,600 / 115,200 bps10 |
| Max. number of connected modules |
32 per bus10 |
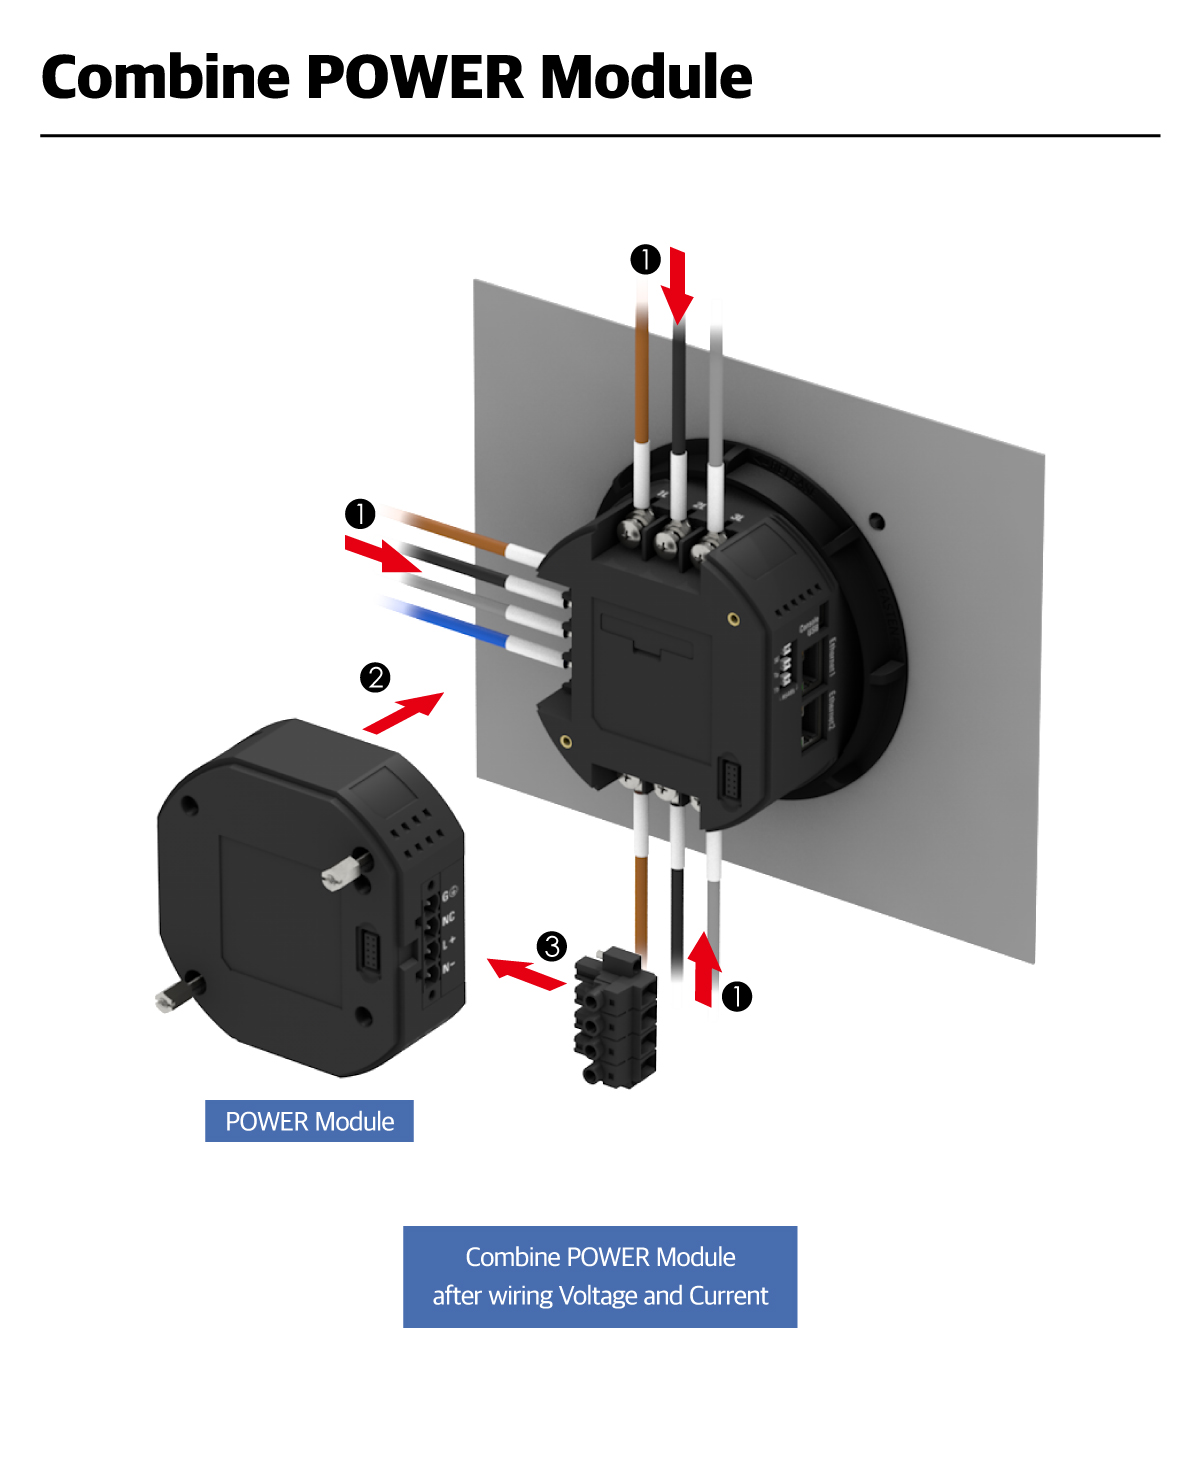
| Power(Supplied from the POWER Module) |
| Port name |
L+, N– |
| Connector type |
Push In conductor (Pluggable) |
| Wire specification / Torque |
0.14 — 4.0 mm2 (26 — 12 AWG), copper / max 0.51 Nm (5.2 kgf-cm, 4.5 lbf-in) |
| Wire temp rating |
70 ˚C or higher |
| Power supply voltage (Us)11 |
AC 100 — 240 V 50 / 60 Hz, DC 100 — 300 V, CAT II |
| Operating voltage range |
0.9 x Us — 1.1 x Us |
|
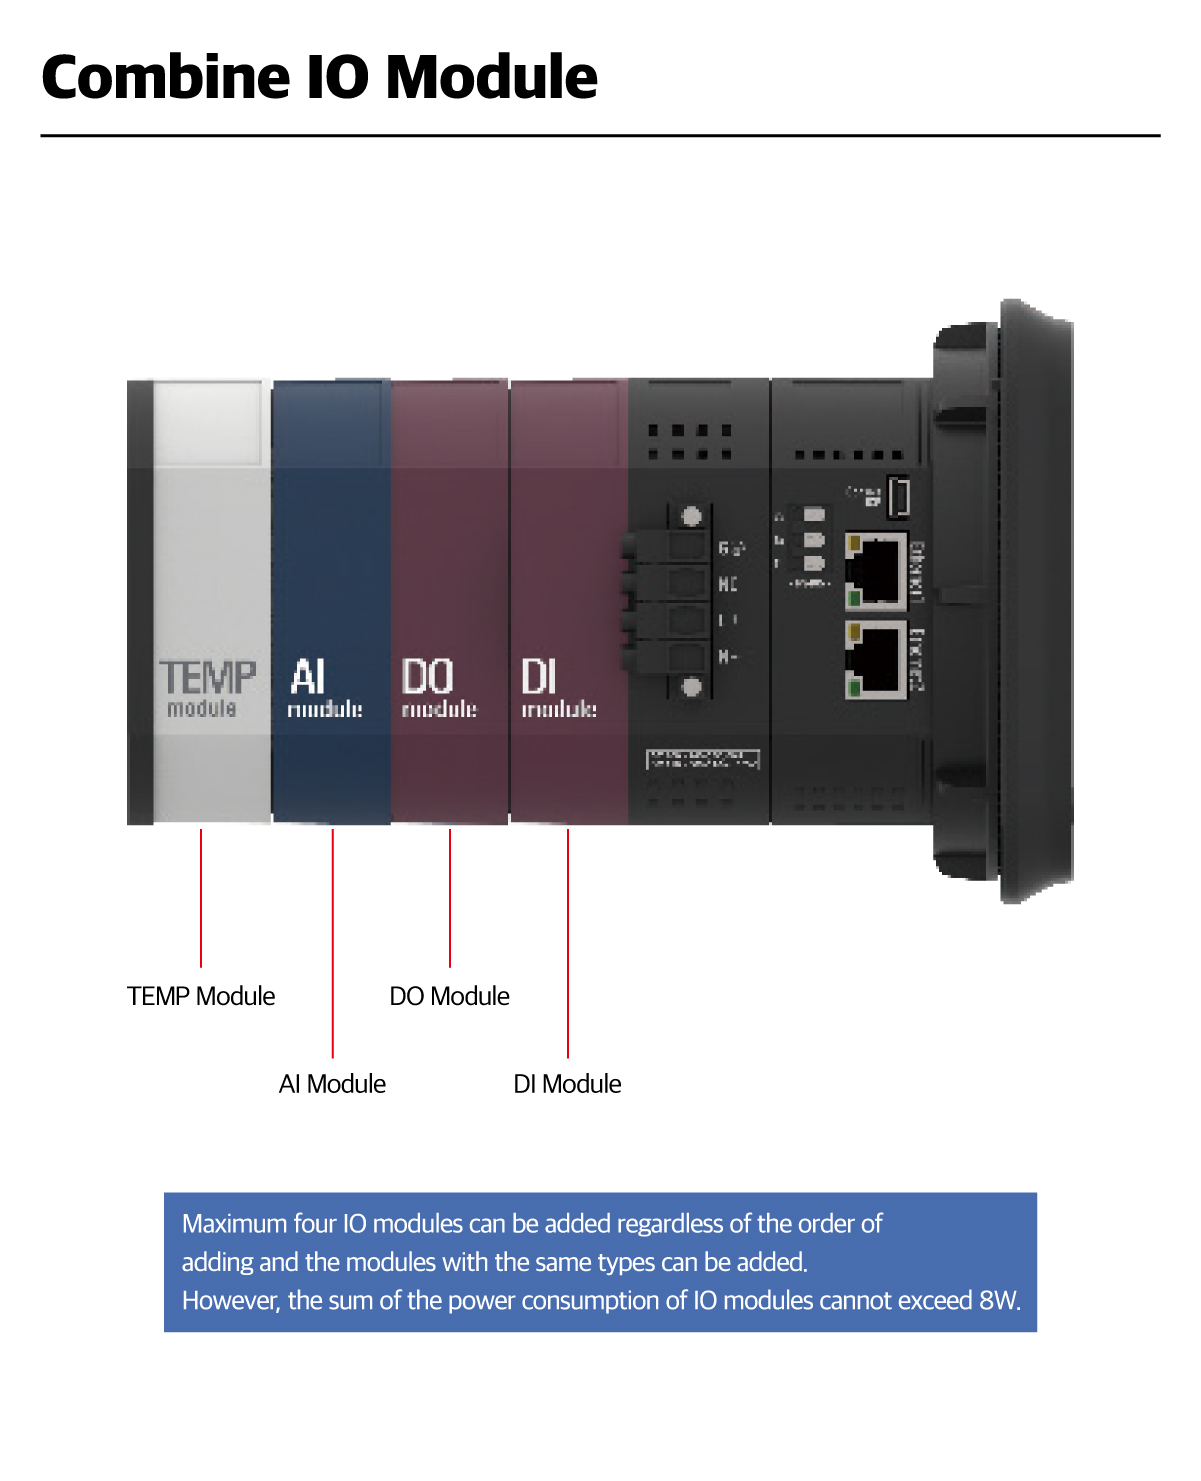
Power Consumption
|
Max. 7 W |
When there are no IO modules connected |
| Max. 15 W12 |
When 4 IO modules are connected |
| Withstand voltage |
AC 3,000 V RMS, 60 Hz for 1 minute |
|
Inrush current13
|
Peak 31 A, duration no more than 1 ms(AC 220 V) |
| Peak 11 A, duration no more than 200 μs(DC 110 V) |
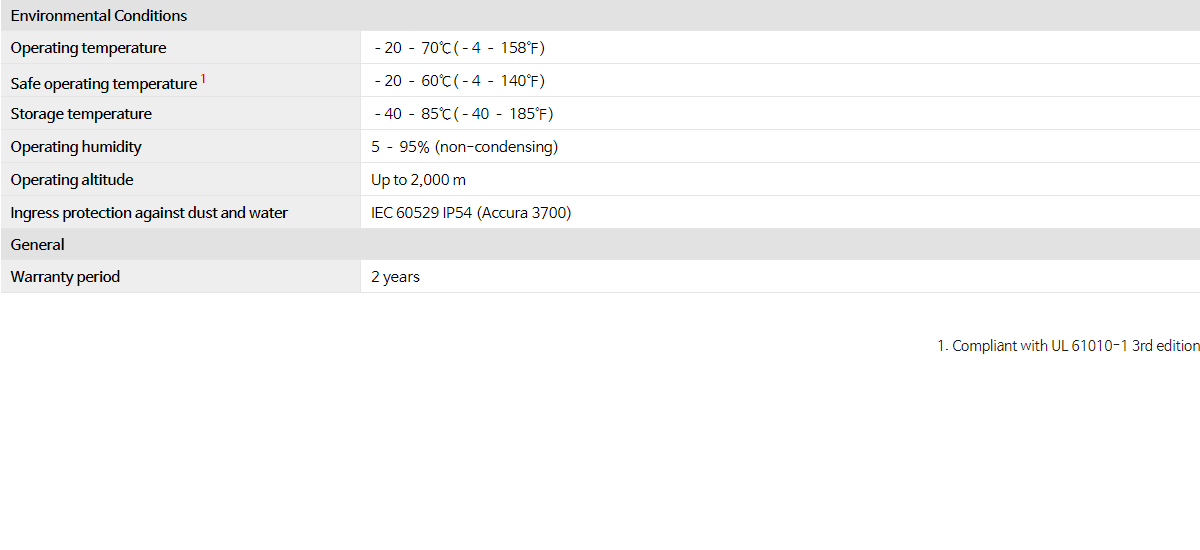
| General |
| Weight |
700 g (including the POWER module) |
1. For Delta connections, do not exceed 480 V ungrounded or 240 V corner grounded.
2. The measured harmonic component indicates the magnitude of line-to-line voltage in 3P3W mode and the magnitude of line-to-neutral voltage in 3P4W mode.
3. The rated voltage Un is 277 V Line-to-Neutral.
4. The rated current In is 5 A/1 A.
5. For active power demand, Received or Net active power can be selected.
6. The predicted demand is calculated based on the thermal demand. The response time for the thermal demand can be set up.
7. The built–in Ethernet switch allows for Ethernet connection between Accura 3700 devices, without a separate external switch.
8. FTP(Foiled Shield Twisted Pair), STP(Braided Shield Twisted Pair), SFTP(Braided Foiled Shield Twisted Pair)
9. RSTP(Rapid Spanning Tree Protocol), IEEE 802.1D-2004.
10. At 115,200 bps, a master can communicate with up to 16 slave devices, and the maximum distance between the master and the slave is 600 m.
11. The device conforms to UL standards for the tested AC power supply voltage.
12. It indicates the maximum power consumption of the connected modules, including Accura 3700 IO module.
13. When installing fuses on the power line, it is recommended to use UL listed Class RK5 fuses above 2 A / 500 V.


 , Current THD:
  ,
, :fundamental voltage,
 :fundamental current
  :peak demand current